
Advanced Analytics
Heatmapping
See where attention goes, and where it’s lost, highlighting where attention concentrates, where it drops off, and what gets ignored.
Benefits
See engagement, attention and friction.
Visualise attention instantly
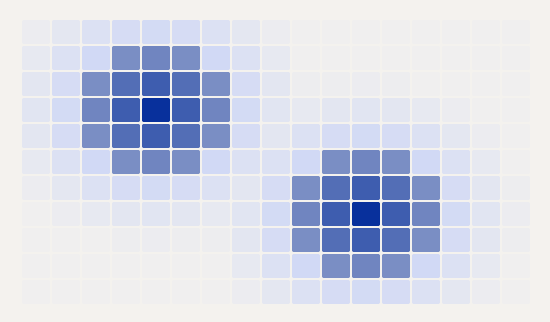
Turns thousands of individual gaze points into a single colour map that shows where focus lands at a glance.
Identify hotspots and blind spots
Highlights the areas pulling the most attention and the zones going completely unnoticed.
Improve layout and clarity
Shows which arrangement guides the eye cleanly so you can position key elements where they will be seen.
The method
What is heatmapping?
Heatmapping shows patterns of visual attention across an image, layout, or interface. Using observed data from eye tracking, clicks or interactions, it highlights areas of high and low engagement through intuitive visual overlays.
Unlike traditional feedback, heatmapping captures behaviour at a glance. It shows what stands out, what competes for attention, and what fails to register.
That makes it particularly valuable for diagnosing performance in visual environments where attention is limited and competition is high.
The result is a clear, immediate understanding of how effectively your content captures attention and communicates key information.
When to use it
Heatmapping is most valuable when visual performance drives outcomes.
01
Website and landing page optimisation
02
Advertising and creative testing
03
Packaging and label evaluation
04
eCommerce page performance
05
User interface and experience design
06
In-store and digital visual environments
Decisions
Decisions it supports
Heatmapping supports decisions where attention, clarity, and visual hierarchy influence performance.
01
Proposition
- Are key features, benefits, and claims being noticed and understood?
02
Brand
- Is the brand being seen clearly and quickly?
- Does it stand out in context?
03
Customer
- Where does attention go first?
- What do users miss or overlook?
04
Communications
- Do layouts guide attention effectively?
- Are key messages being seen in the right order?
How it works
Five steps from asset to diagnostics.
A structured process for capturing and interpreting visual attention.
STEP · 01
Define stimuli
Select the visuals to test, such as webpages, ads, packaging, or interfaces.
STEP · 02
Generate attention maps
Use eye-tracking data or interaction modelling to create heatmaps that show attention intensity across the stimulus.
STEP · 03
Analyse patterns
Identify hotspots, low-visibility areas, and competing elements that dilute attention.
STEP · 04
Diagnose performance
Assess whether visual hierarchy supports key objectives, such as brand visibility, message clarity, or conversion.
STEP · 05
Deliver insights
Provide clear visual outputs with recommendations to improve layout, design, and effectiveness.
Getting started
What you need to begin
- The asset (or variants) at final or near-final fidelity
- A clear creative or design question to answer
- Target audience and viewing context
- A view of how the team will act on the findings
FAQ
Frequently asked questions.
Heatmapping shows where attention is concentrated, often as an aggregated view. Eye tracking captures individual gaze behaviour in detail, including sequence and timing. Heatmapping is faster and scalable. Eye tracking is more precise and diagnostic. Heatmapping can also be done by digital interaction, making it more accessible for those who can’t or won’t use a webcam.
Yes. Heatmaps can be generated using predictive modelling without collecting respondent-level gaze data, making it a cost-effective option for early-stage testing.
You will receive visual heatmaps, attention intensity scores, and clear diagnostics showing what is seen, what is missed, and where improvements can be made, along with the ability to filter or sort the heatmaps to understand the impact by group.
Heatmapping becomes most powerful when linked to behavioural metrics such as clicks, choice, or conversion. This shows how attention translates into action.
Get in touch
Ready to run a heatmapping study?
If you want to understand how users engage and where attention is lost, we can help. Get in touch to discuss your brief.